In order to manage reports in KIU effectively, there are some features you need to familiar with.
→ View the report
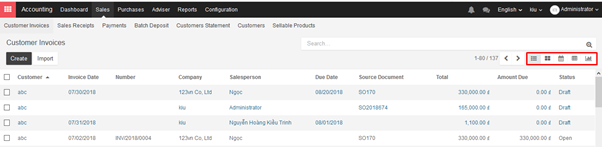
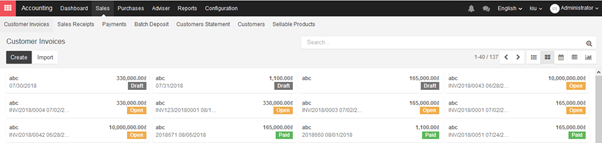
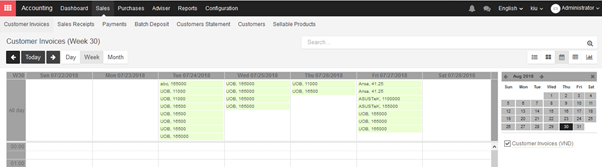
For some reports, you can choose type of data view as List, Kanban, Pivot or Graph at the right corner.
- List view:
- Kanban view:
- Calendar:
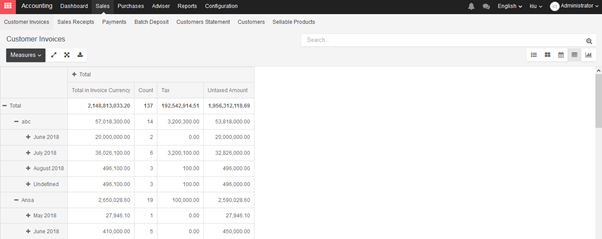
- Pivot:
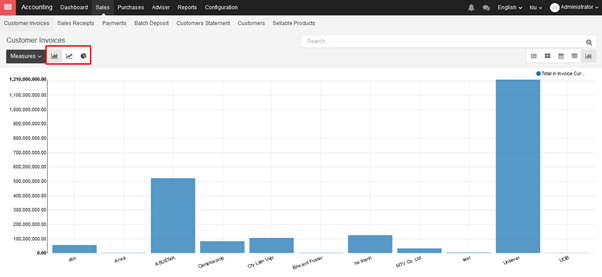
- Graph: You can select type of graph like Line chart, Bar chart and Pie chart.
→ Filter data
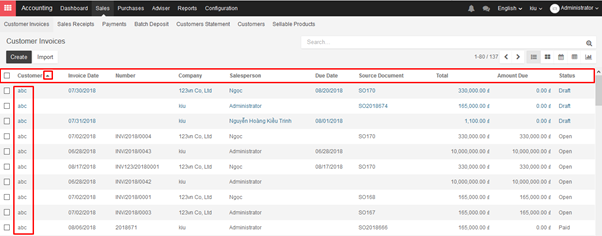
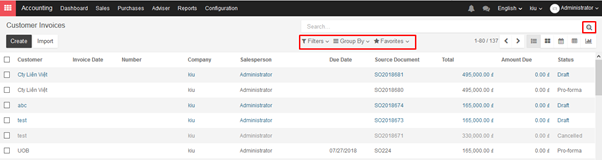
Mostly, report in KIU will be viewed as a list. You can click directly to headline items to sort data in sequence.
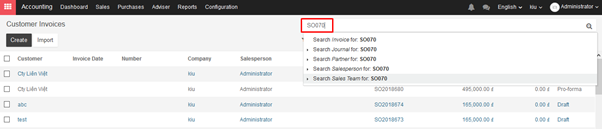
Besides, you can search data of a report via search engine.
Type information and select object you would like to look for.
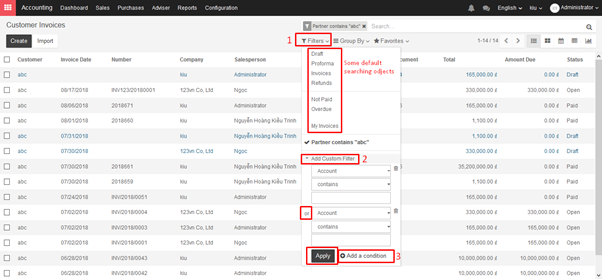
Or you can refine by filter functions:
- Filters function:
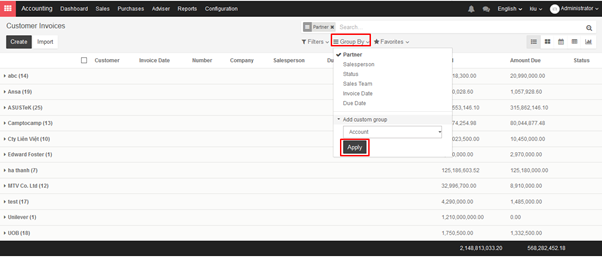
- Group by function:
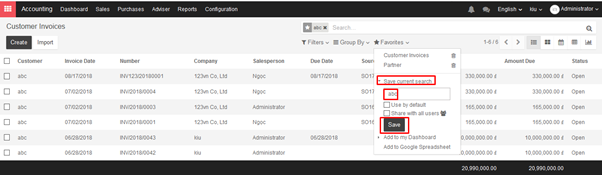
- Favorite function:
This function help you to save filtered information for effortless search next time.
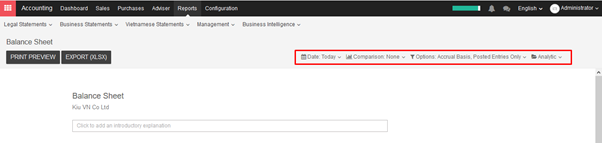
Another type of report is financial reports. You can filter some criterias stated at the right corner.